
티스토리 뷰
1. 개요
1.1 가이드 목표
prometheus와 grafana를 이용하여 모니터링 체계를 구축하는 방법에 대해 이해
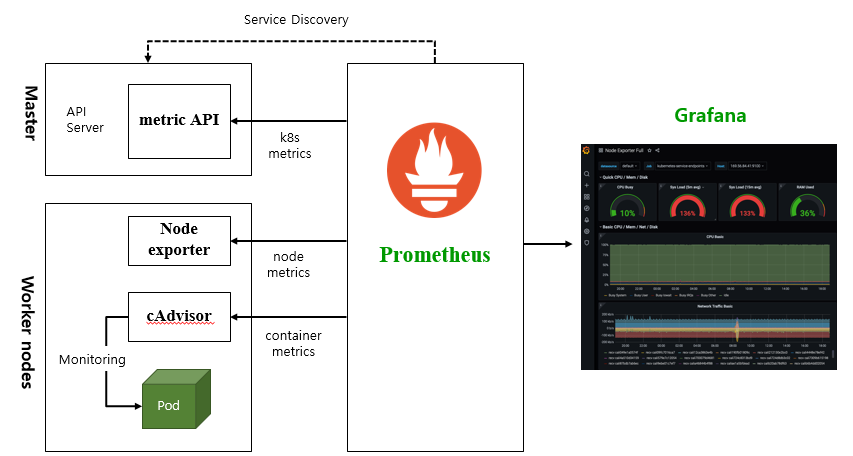
1.2 아키텍처
kubernetes 리소스의 metric(사용현황) 정보를 수집(prometheus)하여 대시보드로
제공 (grafana)할 수 있도록 하기 위해 prometheus와 grafana툴을 이용함
1.3 사전 작업
1) helm 설치
happycloud-lee.tistory.com/3?category=832245
2) helm chart repository 추가
helm repo add prometheus-community https://prometheus-community.github.io/helm-charts
helm repo add kube-state-metrics https://kubernetes.github.io/kube-state-metrics
helm repo add grafana https://grafana.github.io/helm-charts
helm repo update
3) namespace 작성
$ kubectl create ns monitoring
4) NFS Server 설치
happycloud-lee.tistory.com/46?category=832247
5) NSF Dynamic provisioning설정
kubepia.github.io/cloudpak/cp4app/install/ocp04.html
6) 작업 디렉터리 작성
mkdir -p ~/install/monitoring7) kubens 설치
kubens는 namespace변경을 쉽게 해주는 툴입니다.
happycloud-lee.tistory.com/95?category=832243
2. 프로그램 설치
2.1 prometheus 설치
metric을 수집하고 저장하는 프로그램입니다.
1) helm configuration 파일 작성
$ cd ~/install/monitoring
values-prometheus.yaml을 작성합니다.
ingress주소를 적절히 지정합니다.
로그 보관 주기를 적절히 조정합니다. default는 15일입니다.
server:
  enabled: true

  ingress:
    enabled: true
    annotations:
      kubernetes.io/ingress.class: nginx
    hosts:
    - prometheus.169.56.84.41.nip.io

  persistentVolume:
    enabled: true
    accessModes:
      - ReadWriteOnce
    mountPath: /data
    size: 8Gi
  replicaCount: 1

  ## Prometheus data retention period (default if not specified is 15 days)
  ##
  retention: "1d"
2) 설치
$ cd ~/install/monitoring
$ kubens monitoring
$ helm install prometheus -f values-prometheus.yaml prometheus-community/prometheus --dry-run
에러 없으면, 아래 명령으로 설치
$ helm install prometheus -f values-prometheus.yaml prometheus-community/prometheus
모든 pod가 Running 될 때까지 기다립니다.
$ watch kubectl get po
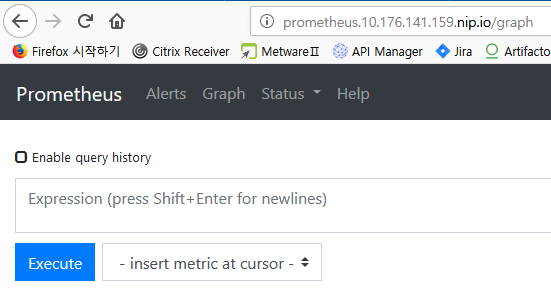
prometheus ingress 주소로 웹페이지에서 열어 봅니다.
$ kubectl get ing
2.2. grafana 설치
prometheus의 데이터를 읽어 대시보드를 제공하는 툴입니다.
1) helm configuration 파일 작성
$ cd ~/install/monitoring
values-grafana.yaml을 작성합니다.
ingress주소와 admin 암호를 적절히 지정합니다.
replicas: 1

ingress:
  enabled: true
  annotations:
    kubernetes.io/ingress.class: nginx
  path: /
  hosts:
    - grafana.169.56.84.41.nip.io

persistence:
  type: pvc
  enabled: false
  # storageClassName: default
  accessModes:
    - ReadWriteOnce
  size: 10Gi
  # annotations: {}
  finalizers:
    - kubernetes.io/pvc-protection

# Administrator credentials when not using an existing secret (see below)
adminUser: admin
adminPassword: passw0rd
2) 설치
$ kubens monoring
$ helm install grafana -f values-grafana.yaml grafana/grafana --dry-run
에러 없으면 설치
$ helm install grafana -f values-grafana.yaml grafana/grafana
모든 pod가 Running될때까지 기다립니다.
$ watch kubectl get po
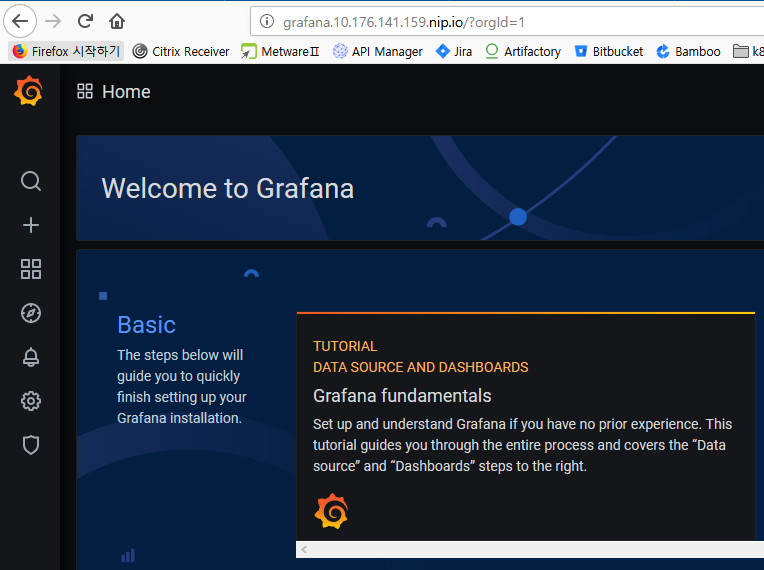
grafana ingress 주소로 웹페이지에서 열어 봅니다.
$ kubectl get ing
http://<grafana ingress host>
values-grafana.yaml에서 지정한 id와 암호로 로그인합니다.
3. 대시보드 작성
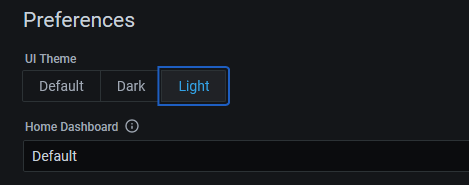
3.1 Skin변경
skin을 Light로 변경합니다.

3.2 Datasource로 prometheus를 연결
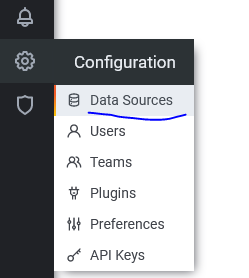
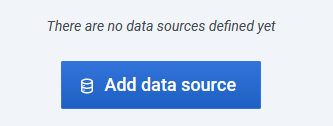
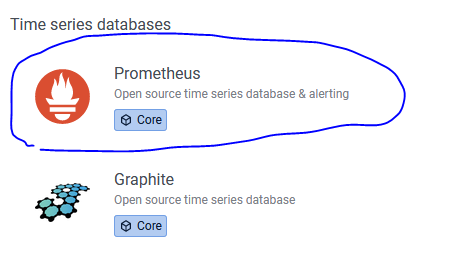

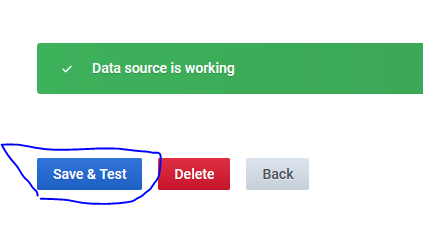
3.3 대시보드 작성
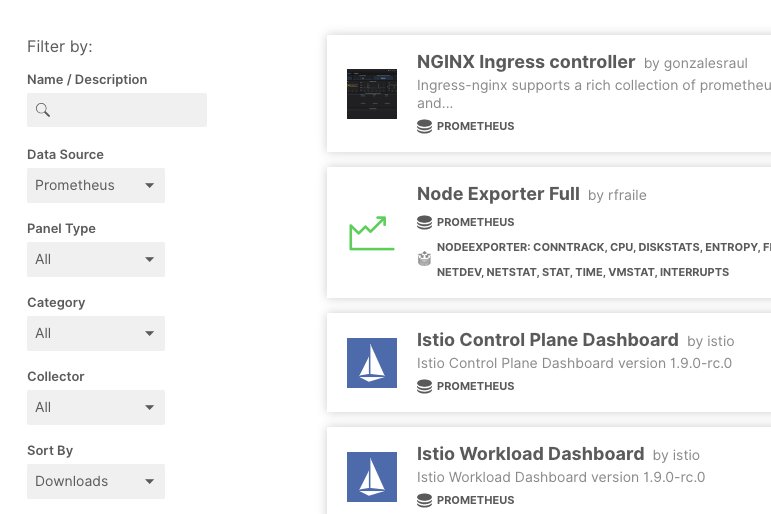
grafana.com/grafana/dashboards
Grafana Dashboards - discover and share dashboards for Grafana.
Grafana.com provides a central repository where the community can come together to discover and share dashboards.
grafana.com
위 사이트에서 Data Source가 Prometheus인 것 중 다운로드 수가 많은 대시보드의 ID를 구합니다.

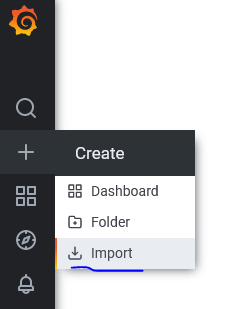
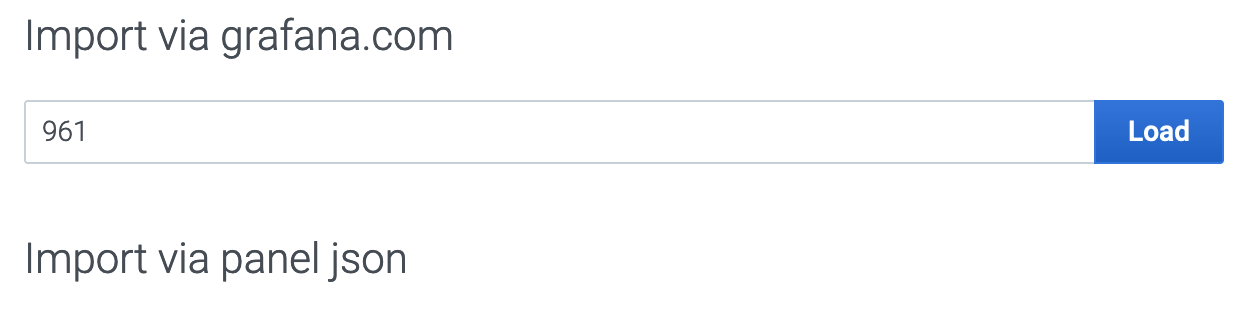
아래와 같이 대시보드를 작성합니다.
위 번호를 입력하고, Load버튼을 누릅니다.
'Cloud > Kubernetes' 카테고리의 다른 글
| kubernetes API Server의 IP 변경하기 (0) | 2021.08.23 |
|---|---|
| OS user생성과 Kubernetes config 자동화 shell (0) | 2021.03.23 |
| EFK스택을 이용한 통합로깅체계 구축 (3) | 2021.02.02 |
| kubeconfig 셋팅 shell (0) | 2020.10.28 |
| NFS서버 설치와 NFS Dynamic Provisioning 설정 (0) | 2020.10.11 |
- Total
- Today
- Yesterday
- #MAS
- 요즘남편 없던아빠
- AXON
- 스핀프로젝트
- CQRS
- 플러그인
- 도파밍
- AI
- spotify
- SAGA
- 스포티파이
- 분초사회
- 버라이어티가격
- agile
- agentic ai
- micro service
- 애자일
- 리퀴드폴리탄
- Event Sourcing
- API Composition
- 마이크로서비스
- 돌봄경제
- 마이크로서비스 패턴
- 디토소비
- 호모프롬프트
- 육각형인간
| 일 | 월 | 화 | 수 | 목 | 금 | 토 |
|---|---|---|---|---|---|---|
| 1 | 2 | 3 | 4 | 5 | 6 | 7 |
| 8 | 9 | 10 | 11 | 12 | 13 | 14 |
| 15 | 16 | 17 | 18 | 19 | 20 | 21 |
| 22 | 23 | 24 | 25 | 26 | 27 | 28 |